Open Service Mesh aims to create a high-performance service mesh while providing all the essential service mesh features. This document describes the tests performed to evaluate the performance and scalability of OSM.
Testing environment
This test is performed on a Kubernetes cluster provisioned and managed by Microsoft Azure Kubernetes Service. The cluster has 100 Standard_DS2_v2 nodes (each node has 2 vCPUs and 7GB memory). It is ensured that there is only one OSM controller pod running with default resource quota during the test. OSM is configured in non-permissive traffic mode.
Process
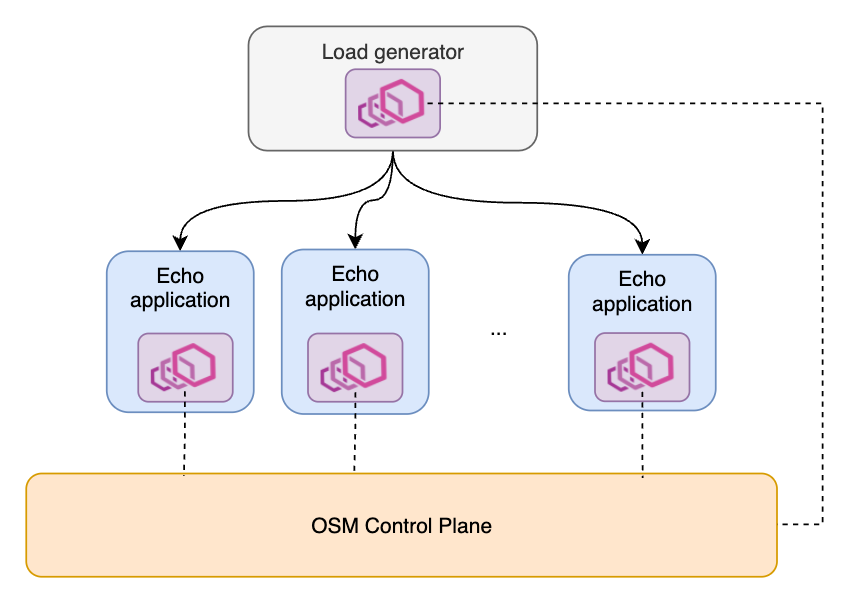
The testing mesh contains two types of services. One is a load generator (modified from wrk2), which can send requests at specified rate, load balanced among all other services in the mesh. Currently we test HTTP 1 requests only. The load generator serves as the client side of a request. Throughout our test, there will be at most one load generator service. The other type of service is a simple echo application that replies with whatever it receives from an inbound request. It serves as the server side of a request. We can deploy multiple copies of the echo application in the mesh. In short, the mesh topology is a typical 1-to-N service architecture.
Performance
In this test, we focus on the latency overhead and resource consumption added by the OSM sidecar. We currently test the per pod RPS at 100, 500, 1000, 2000 and 4000 respectively.
Latency
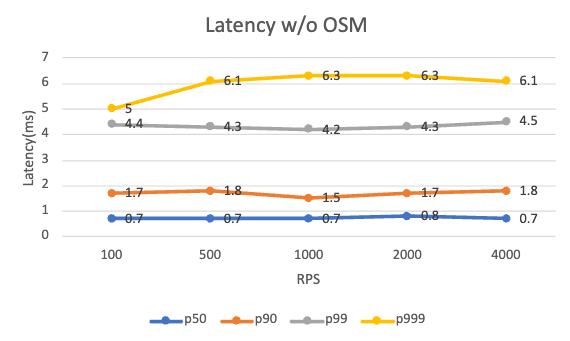
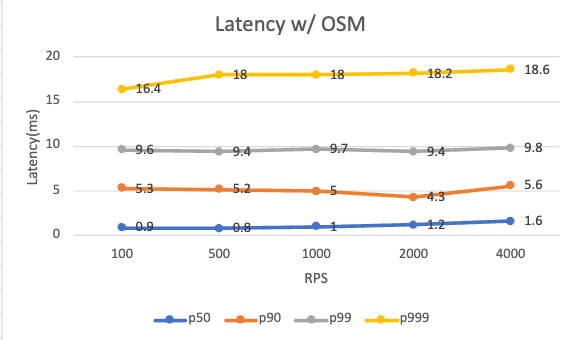
Below is the request latency at different RPS levels with and without OSM installed. The added latency comes from both the client and server sidecars.
| Per pod RPS | 100 | 500 | 1000 | 2000 | 4000 |
|---|---|---|---|---|---|
| P99 latency w/o OSM (ms) | 4.4 | 4.3 | 4.2 | 4.3 | 4.5 |
| P99 latency w/ OSM (ms) | 9.6 | 9.4 | 9.7 | 9.4 | 9.8 |
Regardless of the existence of OSM, the application performs quite similar across different RPS levels tested. OSM adds around 5ms overhead on the 99 percentile latency. Note that our test setup is very simple, with a single client/server relation. Your mileage may vary with more complex applications, or with different traffic policies set on the mesh.
Resource Consumption
Control plane resource consumption is stable as it is not relevant to the data plane request rate.
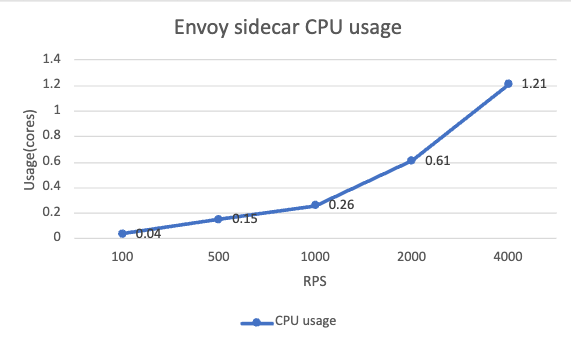
For the sidecars on the data plane, the memory usage is relatively consistent across different RPS levels, which is around 140MB. The CPU usage has a clear increasing trend and it is nearly proportional to the RPS level. In our case, use a baseline CPU of 60 millicores, the sidecar CPU consumption increases linearly around 0.1 cores for every 100 RPS.
Scalability
In the scalability test, we explore how resource consumption changes for both the control plane and the data plane as the number of workloads in the mesh increases. A specified number of echo services will be deployed to the mesh all at the same time. Therefore, the control plane receives a load spike after the deployment starts. All the Envoy sidecars are connecting to the control plane simultaneously. After that, the control plane becomes much more idle. We deliberately create this load spike at pod rollout time in order to see the maximum scale that the mesh can handle. Each round of test will last for 15 minutes. Mesh scale of 200, 400, 800 and 1600 pods will be tested respectively. The load generator service is not used in scalability test.
Control Plane
CPU Usage
Below shows the CPU usage of control plane at both pod-rollout time and stable time:
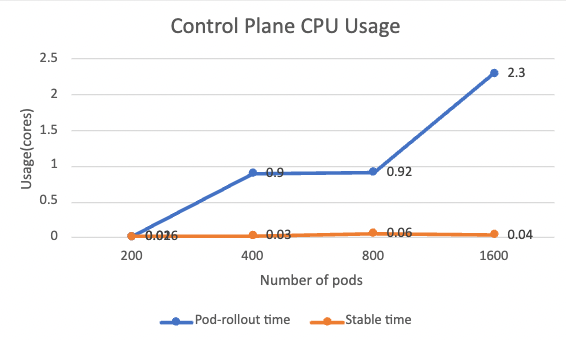
The pod-rollout time CPU usage has a clear increasing trend. This is understandable as the control plane serves all workloads at the same moment, such as issuing certificates and generating xDS configuration. The CPU usage is roughly proportional to the number of workloads. While during the stable time when no new workload is added, CPU usage drops to nearly zero.
Memory Usage
Below shows the memory usage at both pod-rollout time and stable time:
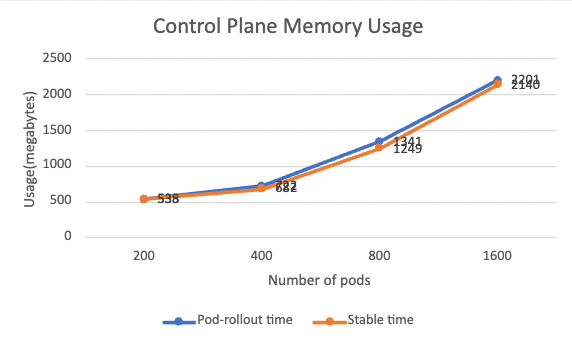
There is not much difference between pod-rollout time and stable time in terms of memory usage. Memory is primarily used to store xDS configurations, which is highly relevant to the mesh scale. The memory usage is also roughly proportionally increasing along with the mesh scale. In our scenario, it takes around 1MB of memory for every one pod added to the mesh.
Data Plane
By looking at the collected metrics, in our testing scenarios, resource consumption of data plane sidecars does not change much along with the mesh size. At stable time, the average CPU usage is close to 0 and average memory usage is around 50MB. CPU usage is related to request processing and memory usage is related the size of Envoy configuration stored locally. These two factors do not change with the mesh scale.
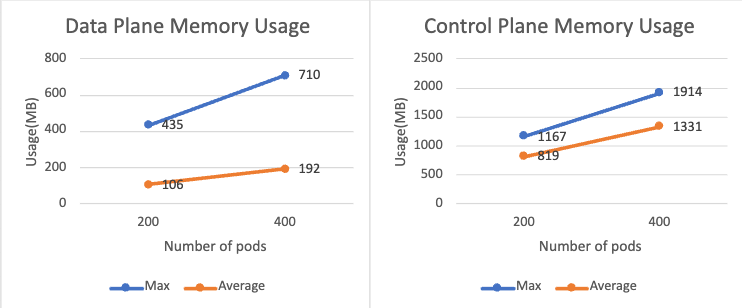
It is also worth mentioning that enabling permissive mode will cause data plane to use much more memory, as each sidecar needs to keep the connection configuration between all other services. The chart below shows the sidecar memory usage when 200 and 400 pods are added in a permissive-mode enabled mesh. Compared to the non-permissive mode, the memory usage is more than doubled. Similar things happen on the control plane.
Feedback
Was this page helpful?
Glad to hear it! Please tell us how we can improve.
Sorry to hear that. Please tell us how we can improve.